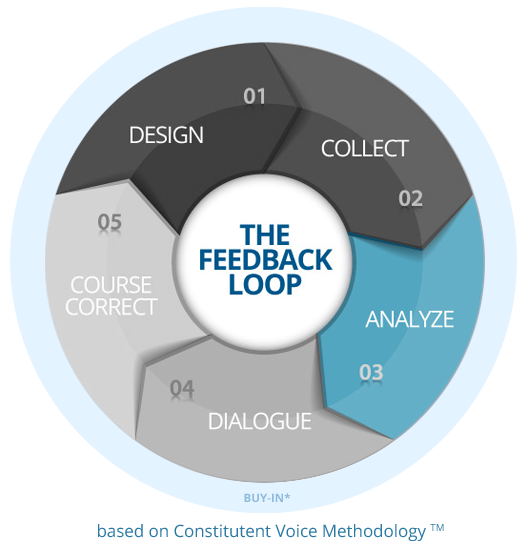
Welcome to Feedback Fundamentals. In this series, we’ll be getting back to the basics and highlighting what it means to “close the loop.” Whether you’re well versed in the jargon or new to the feedback community, this series will introduce you to ideas, frameworks, tools and approaches that we believe are essential for a strong feedback practice. Feedback Fundamentals is all about building a strong foundation and realizing a vision of listening to the people you seek to serve.
Last time, we examined collect – the step in which you ask for and receive feedback. In this article, we examine the analyze step.

Congratulations! You have collected feedback from your beneficiaries! You’re probably staring at a stack of interview forms, a database of text responses, a giant excel spreadsheet of feedback data. Uh oh. Now what?
The purpose of the analyze step of the feedback loop is to look at the raw data you have collected and try to extract insights or patterns from it.
You are trying to construct descriptions of what the data says that you can use to make meaning. There are many ways you can analyze data. Reading the 10 handwritten submissions you collect in a comment box and reflecting on patterns in what you’re reading is data analysis. Collecting 10,000 texts that rank your services on a 0 to 10 scale, and then running a statistical regression on that data is also data analysis. With so many options, it’s important that you choose the right analysis for your circumstances.
Sometimes, it can feel like if you can do a certain type of analysis on your data, then you should. But that can lead you to invest a lot of time and effort into analyses that might have very little relevance or pay-off for you. With so many possible analyses you can do, you want to choose wisely. Be guided by the decisions you made in the buy-in and design stages of the feedback loop. What questions are your stakeholders most interested in answering through feedback? What times of potential decisions or changes are on the table? This can help guide your choice of analysis.
When it comes to the actual analysis, there are many good online resources. The analysis you choose will depend on what type of data you have. Quantitative data is anything that can be expressed as a number, while qualitative data cannot and is instead described in natural language. Text analytics, storytelling or case study analysis can help you analyse qualitative data. Analysis in Excel or statistical softwares like Stata or R might be appropriate for quantitative data. Remember to match the analysis you choose to your capabilities and your needs! If you don’t feel you have the expertise you need to analyze the feedback data you have collected, consider reaching out to a group like DataKind or enrolling in a free online course. Or, consider using specific products or a data collection platform with built-in data dashboards that help you analyze the data you collect.
Remember that how you present your analysis can affect how much people will find it useful and relevant. Results visualization is important. It can also be useful to combine qualitative and quantitative analysis in reports, and compare the results over time.
The analyze step is when you start to really give meaning to the feedback data you have collected. It’s an exciting time! Just remember to stay grounded in your organization’s needs. And don’t pass up the opportunity to involve the people whom you seek to serve!
Next up:, We’ll talk dialogue– taking the raw data and analysis back to your stakeholders and constituents, and engaging them in a sense-making process that respects their expertise and involves them in active co-creation of solutions.


